Almost every test a TradeStation trader actually uses.
WalkStrat is opinionated: each tab answers one specific question about how your strategy behaved under testing. No fluff, no fake AI, no cloud uploads.
Generate
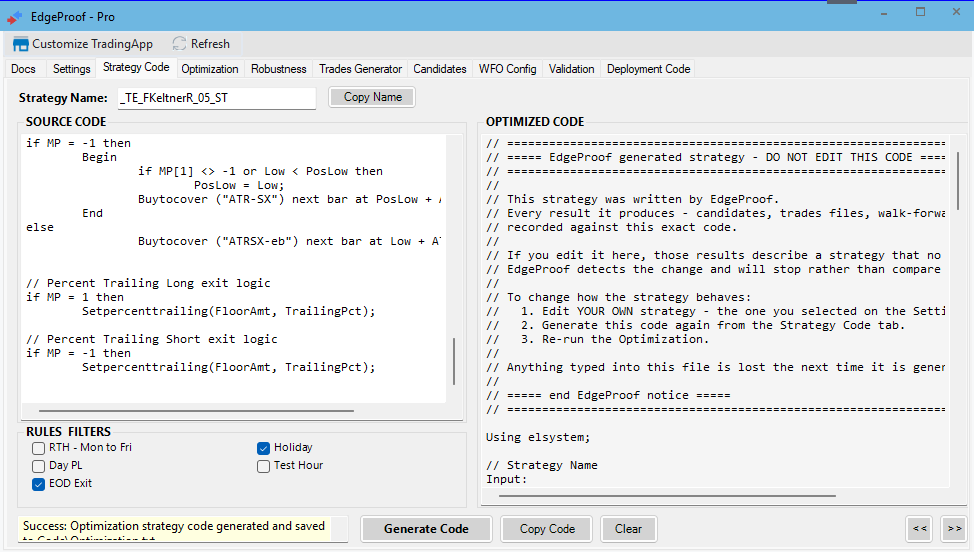
EasyLanguage code generation
WalkStrat generates the instrumented strategy code each test runs on. Compiled in TradeStation with no manual rewriting.
Illustrative result from a test run. No result predicts future performance.
TradeStation Technologies, Inc. All rights reserved.
Trades Generator
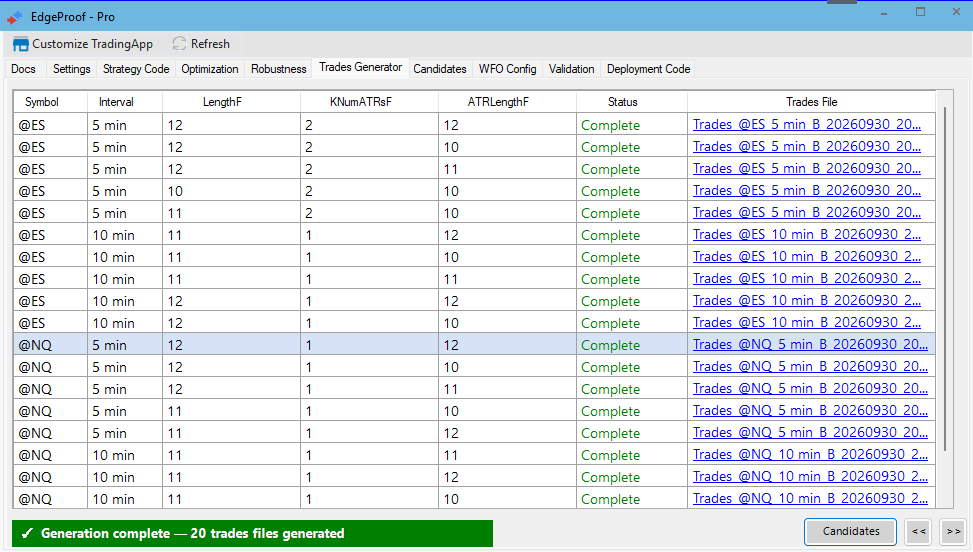
Batch-run your strategy across symbols, intervals and parameter sets. Each combination produces a trades file ready for analysis — no manual exports.
Illustrative result from a test run. No result predicts future performance.
TradeStation Technologies, Inc. All rights reserved.
Diagnostics
Equity Curve (IS/OOS aware)
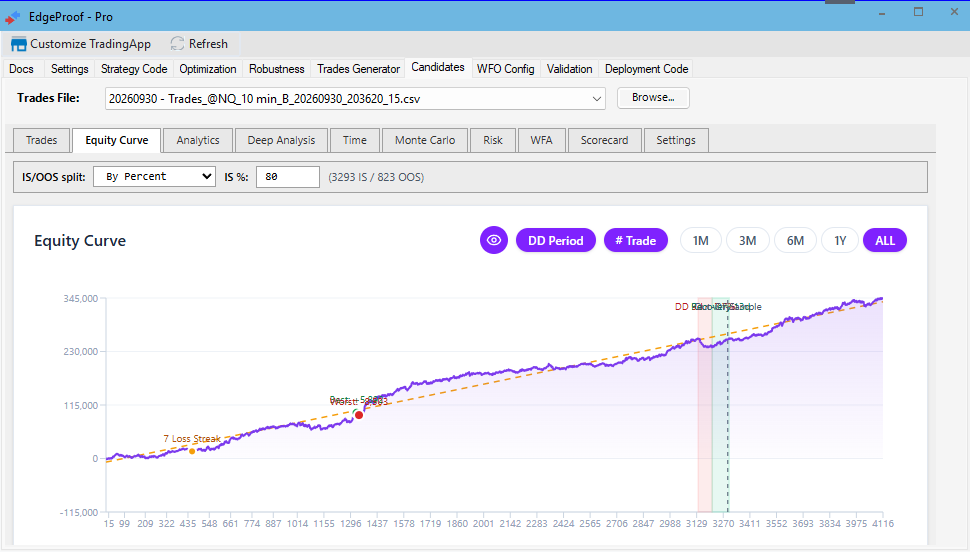
Cumulative P&L with the IS/OOS boundary marked. The shape is the first qualitative signal — long flats and flattening tails are immediately visible.
Illustrative result from a test run. No result predicts future performance.
TradeStation Technologies, Inc. All rights reserved.
Analytics dashboard
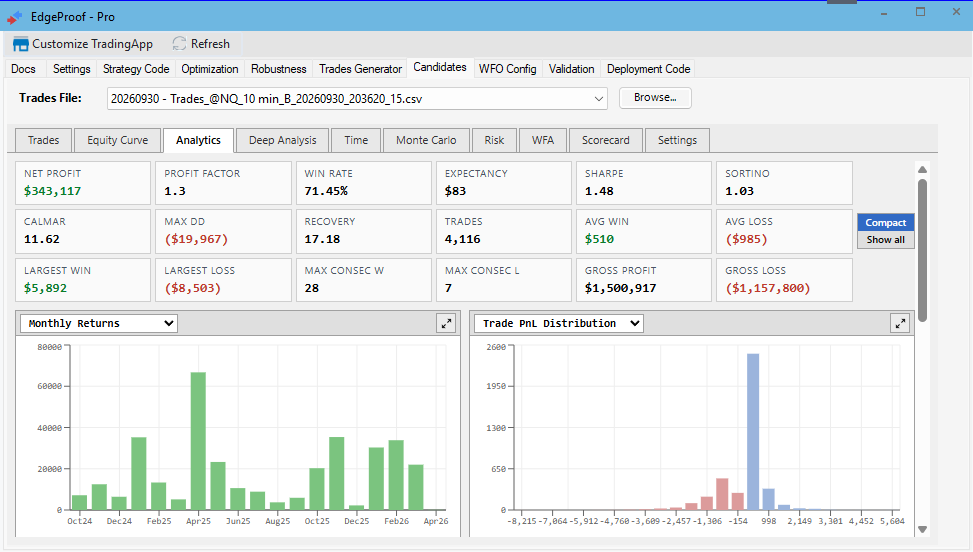
Monthly returns, drawdown curve, monthly heatmap and trade distribution. The qualitative signals you check before any deeper test.
Illustrative result from a test run. No result predicts future performance.
TradeStation Technologies, Inc. All rights reserved.
Monte Carlo + Risk of Ruin
Resample trade returns with user-selected iterations. Reports median / 5th / 95th percentile equity, expected max drawdown, and Risk of Ruin.
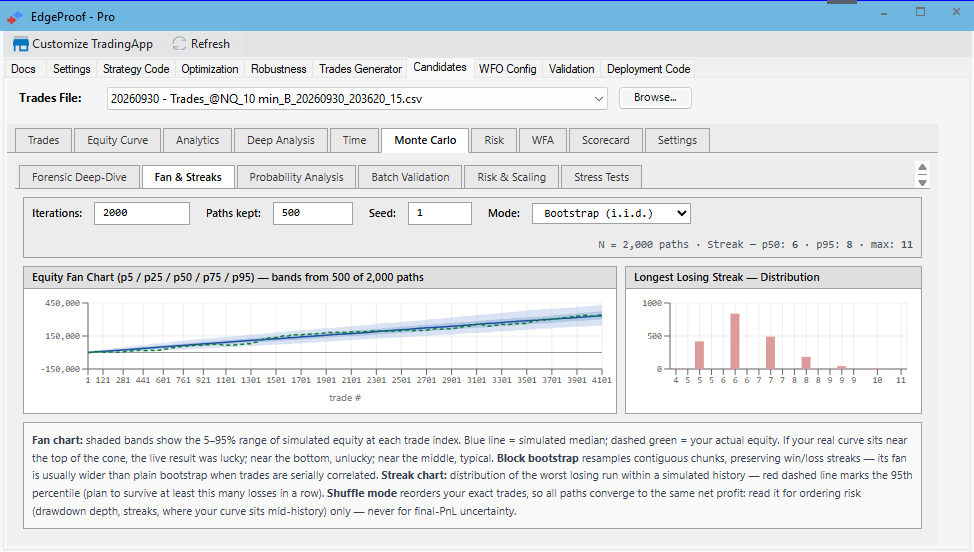
Illustrative result from a test run. No result predicts future performance.
TradeStation Technologies, Inc. All rights reserved.
Validation
Walk-Forward Validation Runs
IS/OOS split with per-segment KPIs, an overall WFO Efficiency ratio (OOS / IS), and a per-segment table that shows which window broke down.
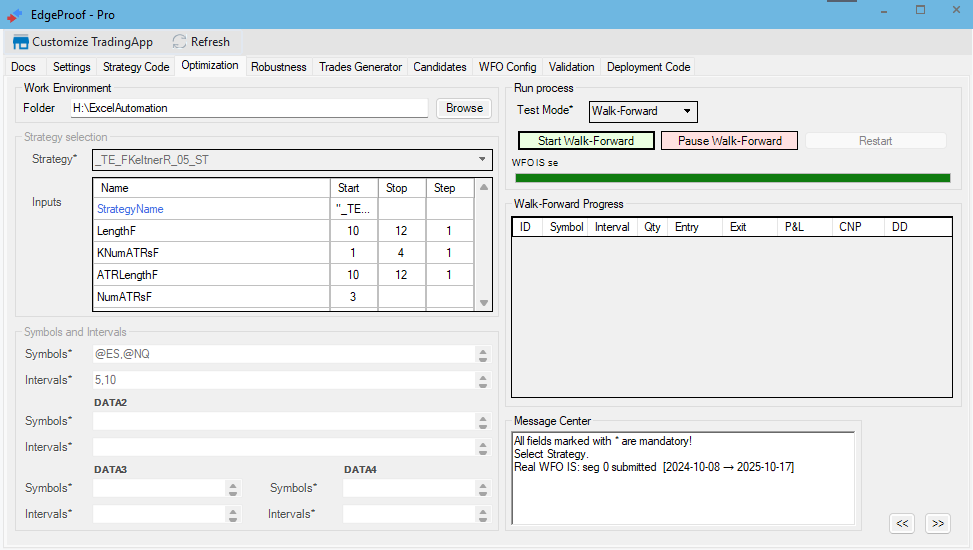
Illustrative result from a test run. No result predicts future performance.
TradeStation Technologies, Inc. All rights reserved.
Walk-Forward Cluster
A 2-D sweep over (Segments × OOS%), re-slicing results you have already produced. It shows whether a walk-forward configuration is representative or a lucky cell, without re-running the optimizer for every combination.
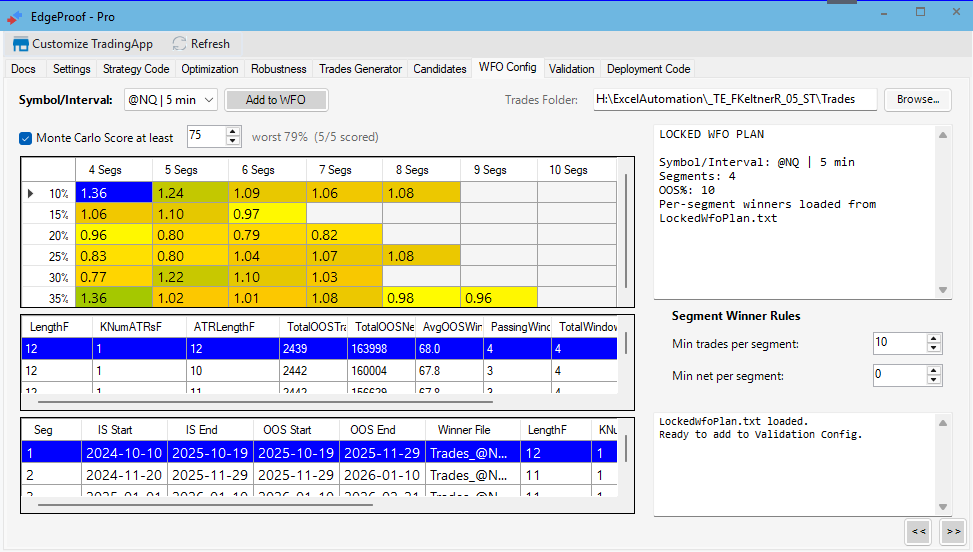
Illustrative result from a test run. No result predicts future performance.
TradeStation Technologies, Inc. All rights reserved.
Validation
Compare a candidate's expected metrics against an actual live-equivalent run. Net P&L, Max DD, Win Rate, Profit Factor and Avg Trade — side by side with diff %.
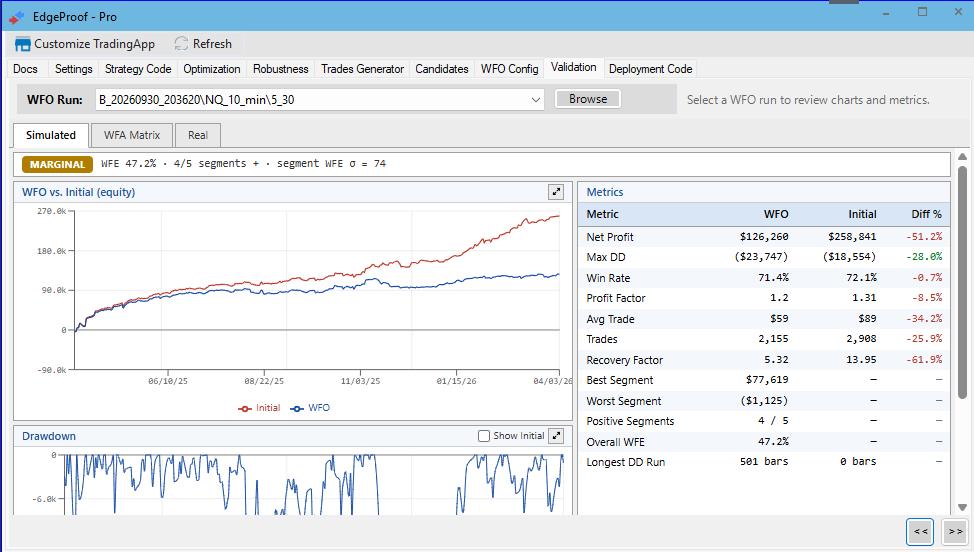
Illustrative result from a test run. No result predicts future performance.
TradeStation Technologies, Inc. All rights reserved.
Workflow
Native TradeStation integration
WalkStrat opens directly inside TradeStation Desktop and receives your strategy trades automatically — no exports, no copy-paste, no setup.
100% local computation
Your trade data is parsed and analyzed entirely on your machine. Nothing is uploaded, nothing is logged. Works offline after first load.
Editable rule thresholds
Set thresholds for net profit, trades, profit factor, average trade, expectancy, drawdown and the binomial filter.
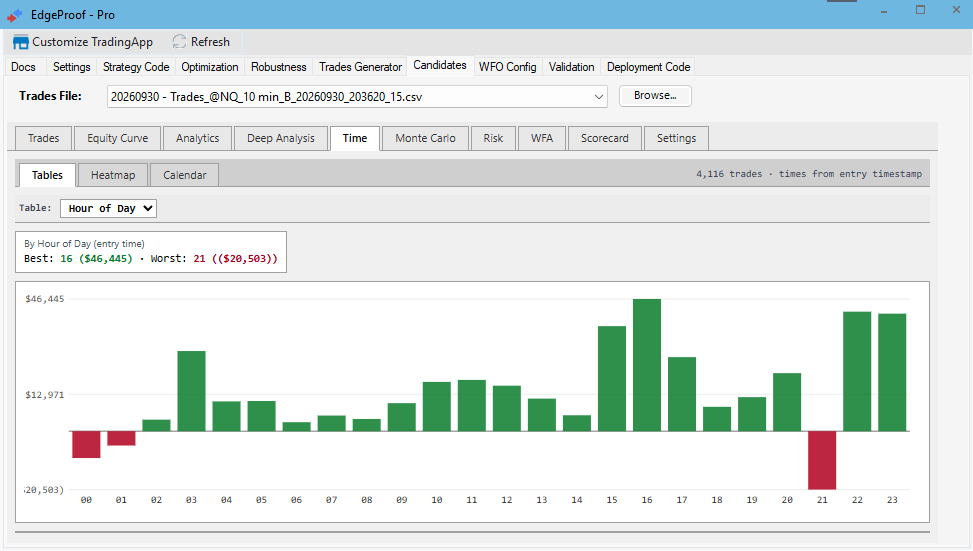
Time Analysis — Tables
Performance bucketed by hour of day makes strong and weak trading periods visible.
Illustrative result from a test run. No result predicts future performance.
TradeStation Technologies, Inc. All rights reserved.
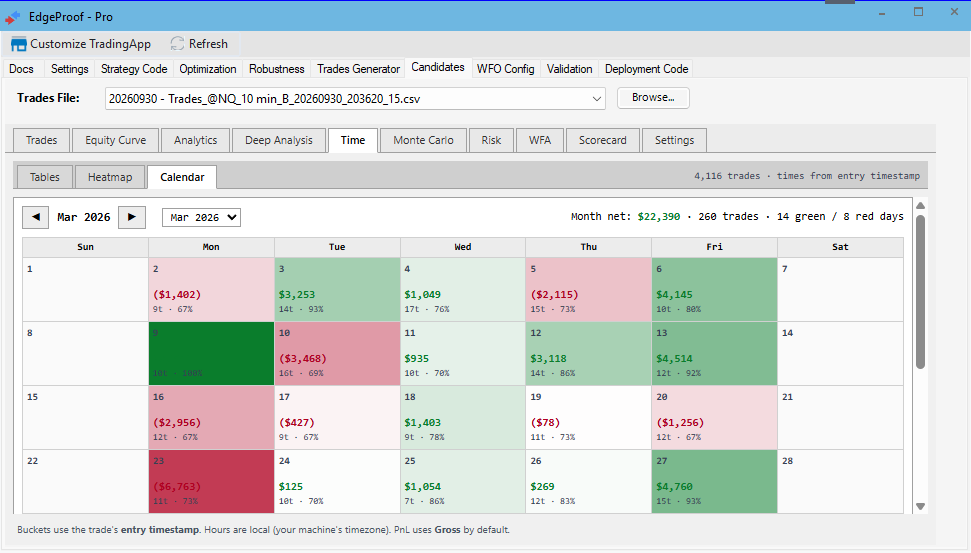
Time Analysis — Calendar
A calendar view reveals daily results, trade counts and win rates across each month.
Illustrative result from a test run. No result predicts future performance.
TradeStation Technologies, Inc. All rights reserved.
The whole workflow, tab by tab.
These are unretouched captures of WalkStrat running inside TradeStation Desktop, in the order you would actually use them.
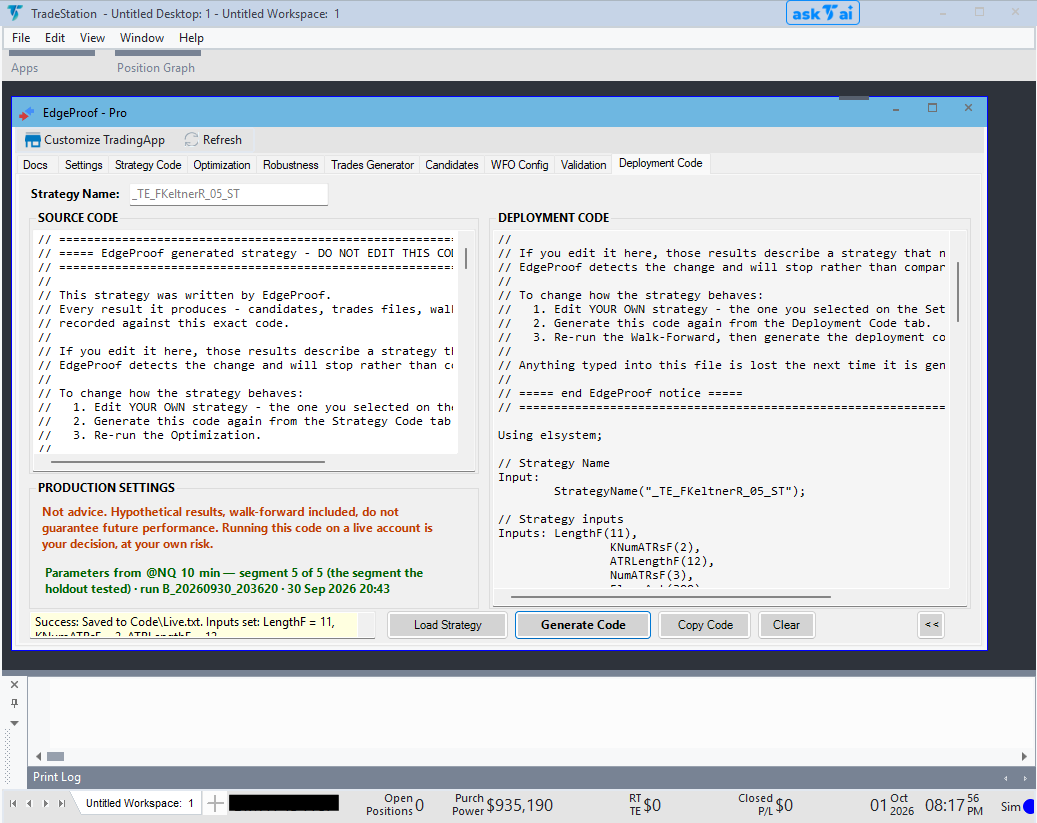
Not a website and not a separate program — it docks into your existing TradeStation Desktop and workspace.
Illustrative result from a test run. No result predicts future performance.
TradeStation Technologies, Inc. All rights reserved.
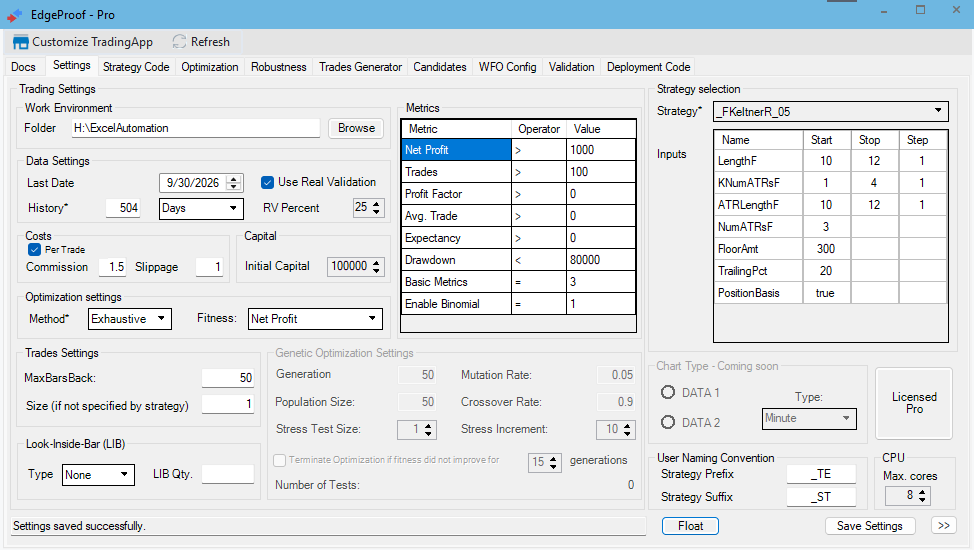
Set the work folder, costs, capital, reserved holdout period, optimization method, and the metric thresholds candidates must clear.
Illustrative result from a test run. No result predicts future performance.
TradeStation Technologies, Inc. All rights reserved.
Generate the instrumented EasyLanguage strategy used throughout the testing workflow, with the selected rules and filters included.
Illustrative result from a test run. No result predicts future performance.
TradeStation Technologies, Inc. All rights reserved.
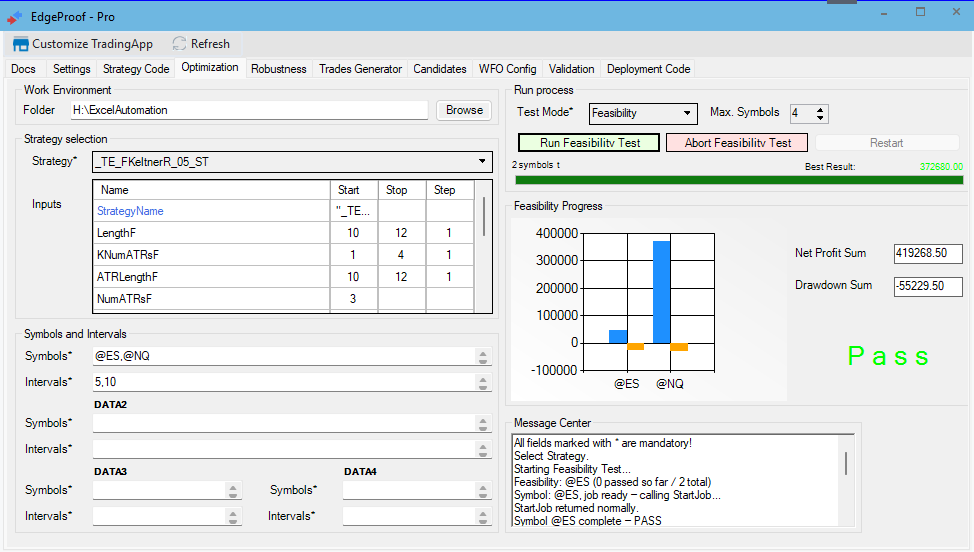
A feasibility pass checks whether the idea warrants a full parameter sweep before committing time to the larger run.
Illustrative result from a test run. No result predicts future performance.
TradeStation Technologies, Inc. All rights reserved.
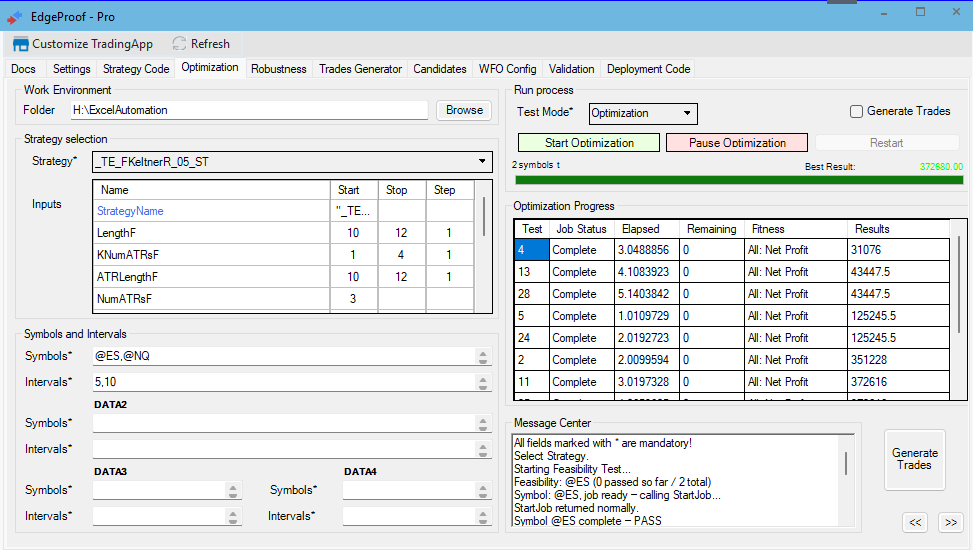
Run the selected sweep and follow its progress across every requested symbol, interval and parameter combination.
Illustrative result from a test run. No result predicts future performance.
TradeStation Technologies, Inc. All rights reserved.
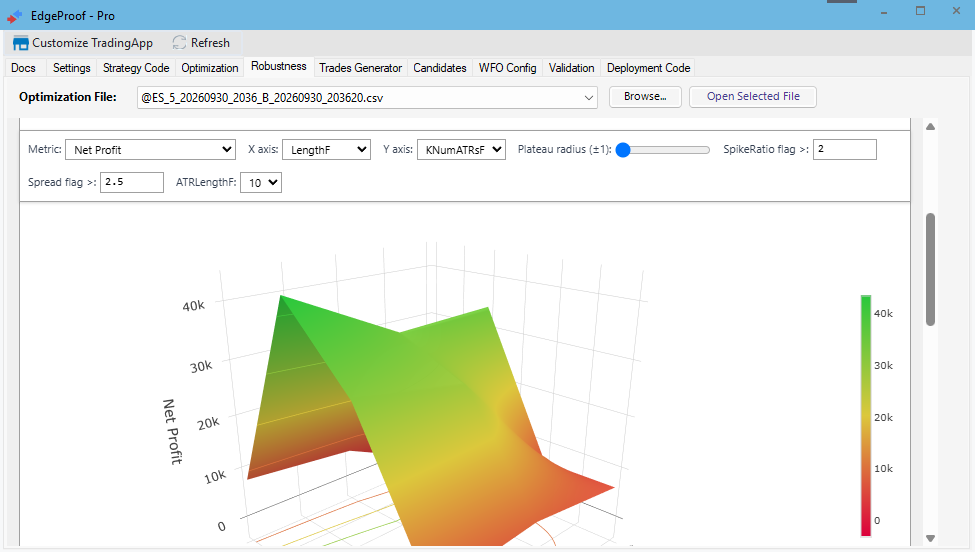
Inspect the parameter landscape for a broad plateau rather than an isolated peak.
Illustrative result from a test run. No result predicts future performance.
TradeStation Technologies, Inc. All rights reserved.
The surviving parameter sets become one trades file per combination — the raw material for every test that follows.
Illustrative result from a test run. No result predicts future performance.
TradeStation Technologies, Inc. All rights reserved.
The curve and its in-sample and out-of-sample sections make changes in behaviour easier to spot.
Illustrative result from a test run. No result predicts future performance.
TradeStation Technologies, Inc. All rights reserved.
Review the candidate's core statistics, monthly returns and trade distribution before deeper testing.
Illustrative result from a test run. No result predicts future performance.
TradeStation Technologies, Inc. All rights reserved.
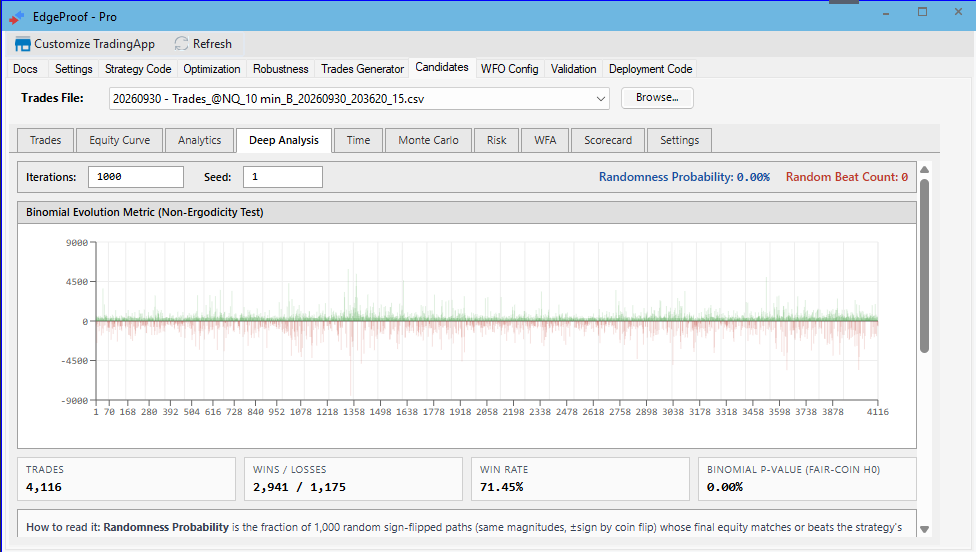
Test whether the sequence shows evidence beyond random sign-flipped paths with the same trade magnitudes.
Illustrative result from a test run. No result predicts future performance.
TradeStation Technologies, Inc. All rights reserved.
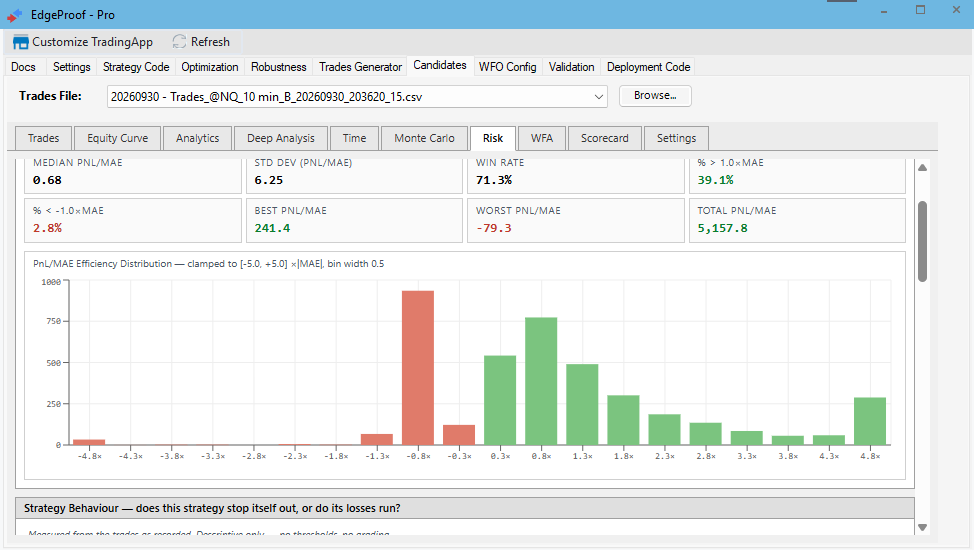
Inspect loss behaviour and test how increasing trading costs affect the result.
Illustrative result from a test run. No result predicts future performance.
TradeStation Technologies, Inc. All rights reserved.
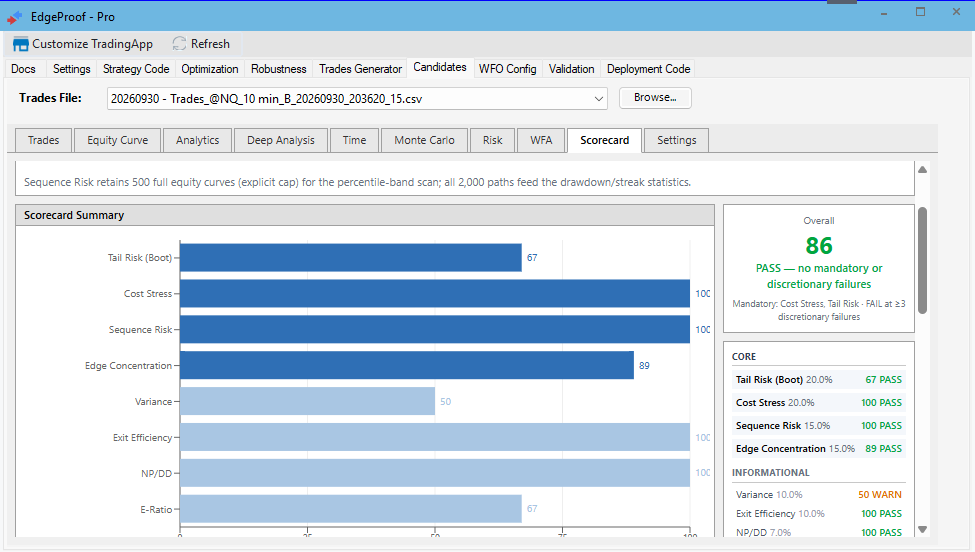
Bring the diagnostic tests together in a weighted scorecard with pass, warning and failure states.
Illustrative result from a test run. No result predicts future performance.
TradeStation Technologies, Inc. All rights reserved.
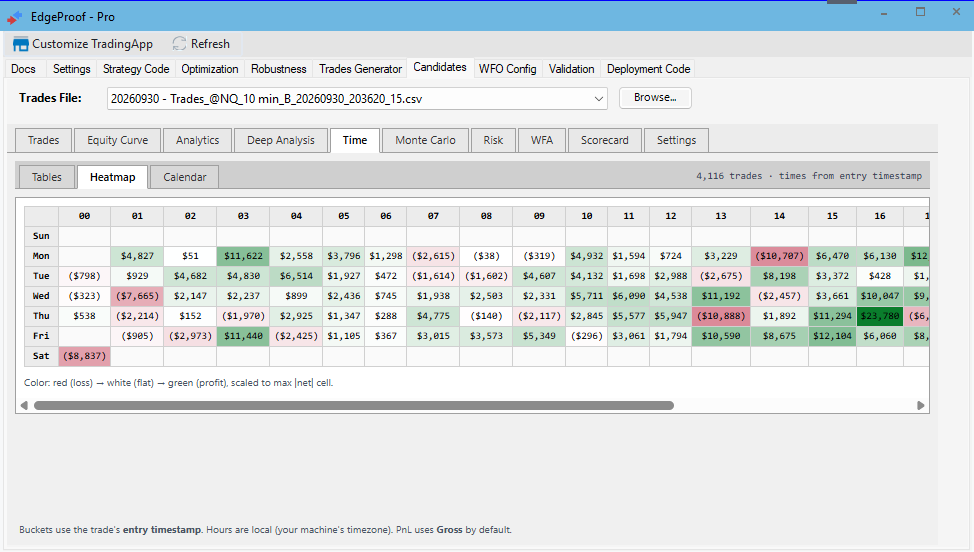
Compare results by weekday and entry hour to expose concentrations hidden by aggregate statistics.
Illustrative result from a test run. No result predicts future performance.
TradeStation Technologies, Inc. All rights reserved.
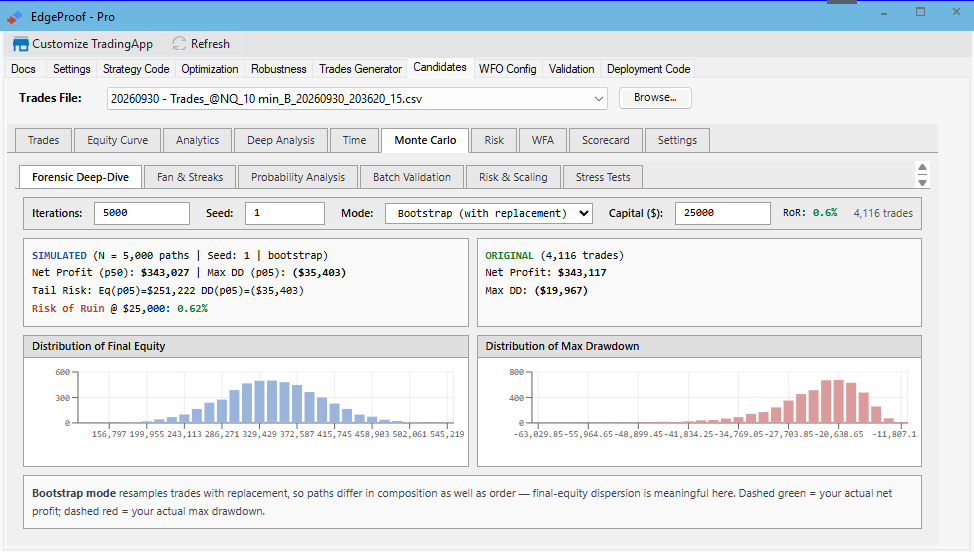
Compare simulated final-equity and drawdown distributions with the original run, including tail risk and risk of ruin.
Illustrative result from a test run. No result predicts future performance.
TradeStation Technologies, Inc. All rights reserved.
Confidence bands around the equity path sit beside the losing-streak distribution.
Illustrative result from a test run. No result predicts future performance.
TradeStation Technologies, Inc. All rights reserved.
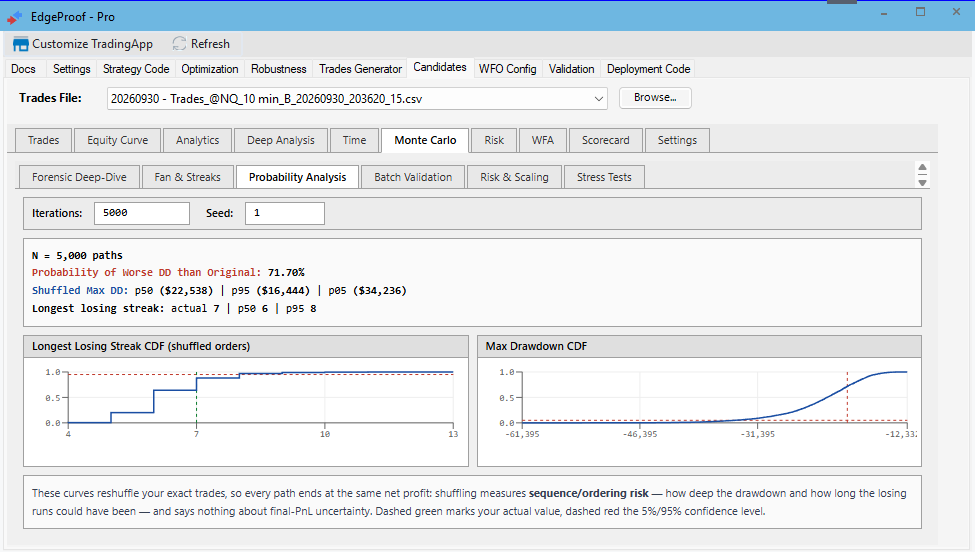
Cumulative distributions express final-equity and drawdown outcomes as probabilities.
Illustrative result from a test run. No result predicts future performance.
TradeStation Technologies, Inc. All rights reserved.
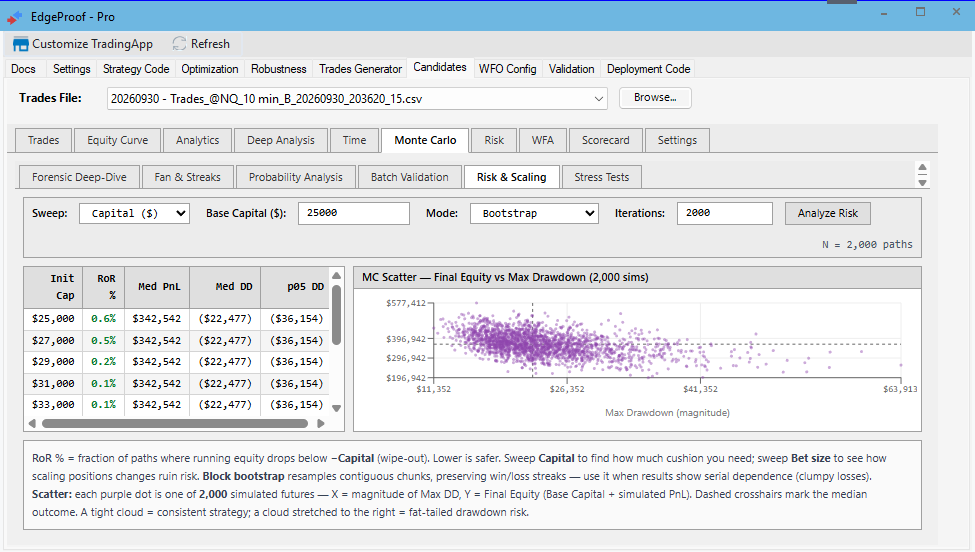
Explore how capital and position size change the distribution of simulated drawdown risk.
Illustrative result from a test run. No result predicts future performance.
TradeStation Technologies, Inc. All rights reserved.
Scout the Segments × OOS% matrix, review the candidate configuration, and lock the walk-forward plan to validate.
Illustrative result from a test run. No result predicts future performance.
TradeStation Technologies, Inc. All rights reserved.
Run the selected walk-forward plan through its in-sample and out-of-sample segments.
Illustrative result from a test run. No result predicts future performance.
TradeStation Technologies, Inc. All rights reserved.
Each in-sample window is re-optimized and its winner applied untouched to the next unseen segment, then compared with the initial baseline.
Illustrative result from a test run. No result predicts future performance.
TradeStation Technologies, Inc. All rights reserved.
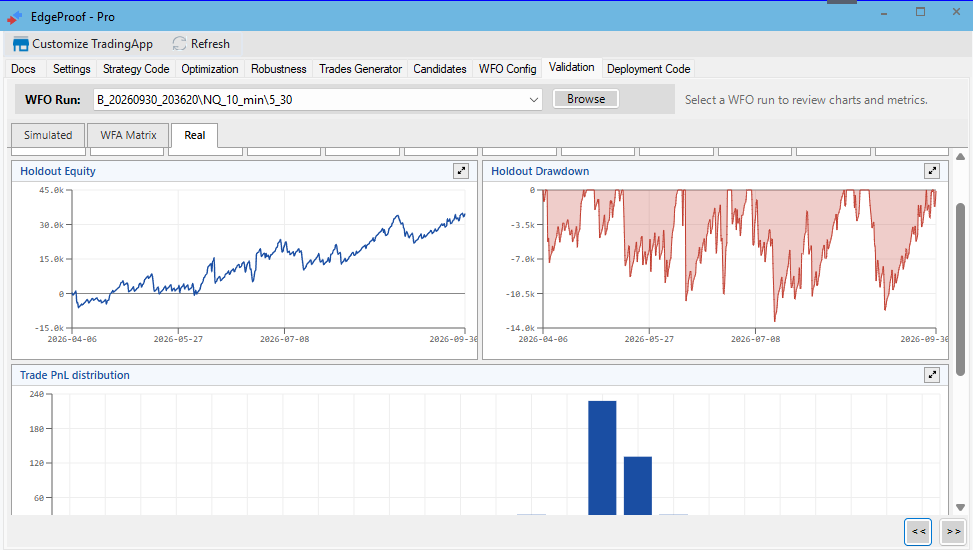
Where a reserved holdout exists, review how the selected plan behaved on history withheld before any optimization.
Illustrative result from a test run. No result predicts future performance.
TradeStation Technologies, Inc. All rights reserved.
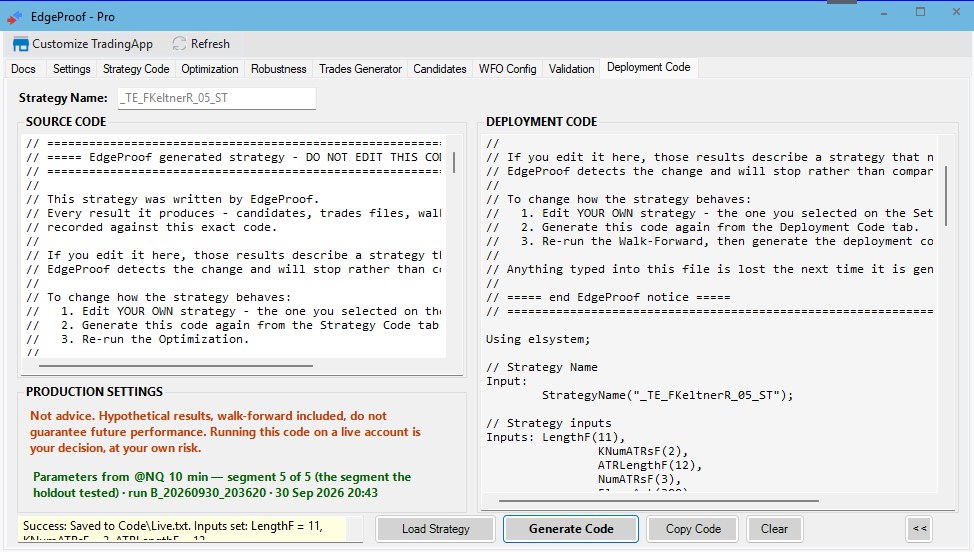
Load the Strategy Code output, apply the selected Input defaults, then copy the EasyLanguage code to compile and run in TradeStation.
Illustrative result from a test run. No result predicts future performance.
TradeStation Technologies, Inc. All rights reserved.