Tab Reference
Every WalkStrat tab, field by field.
WalkStrat's tabs live inside TradeStation's TradingApp, with two native tabs (Settings and Optimization) and several externally built tabs. A Docs tab at the front of the strip holds the app's own built-in reference material — open it any time, independent of the workflow below. Work through the rest left to right; the >> / << buttons on most tabs move to the next/previous step in the guided flow rather than simply moving one tab over — see the note at the end of this page for exactly where each arrow goes.
In this page
- Settings
- Strategy Code
- Optimization
- Trades Generator
- WFO Config
- Walk-Forward Run
- Robustness
- Candidates
- Validation
- Deployment Code
- Docs
- A note on
>>/<<navigation
Settings
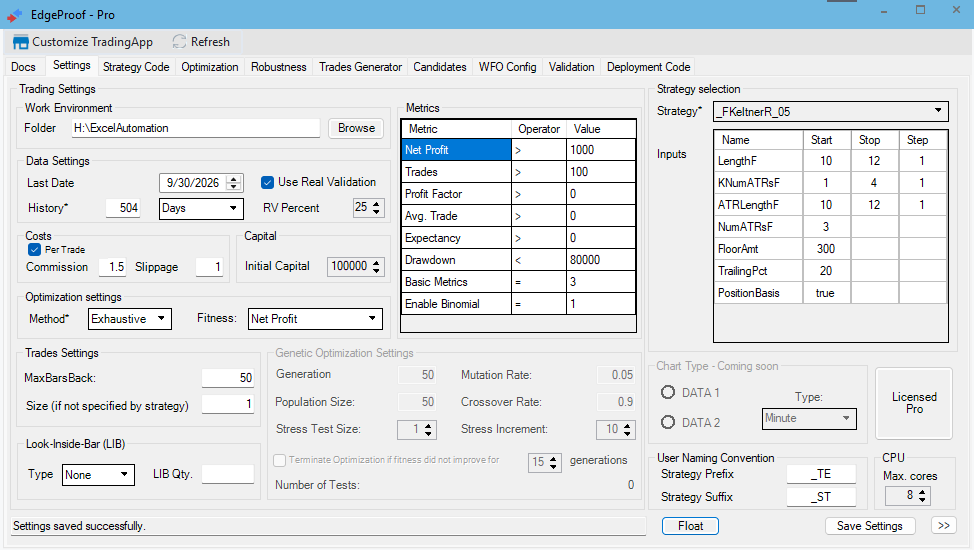 Settings tabIllustrative result from a test run. No result predicts future performance.TradeStation Technologies, Inc. All rights reserved.
The Settings tab is native to TradeStation and it is the foundation of every session — every tab after it works from what is set here.
Set the Working Folder first. Nothing else on this tab, or any other tab, works without it.
Every pre-filled value on this tab is a starting default. Prefix/Suffix text, DaysBack, RV Percent, Commission/Slippage, the Metrics thresholds, MaxBarsBack, Trade Size, Genetic Optimization settings — all of it ships with a reasonable starting point, and all of it can be changed. Review every field against the strategy, instrument and account actually in use before relying on any result, rather than assuming the shipped numbers suit this particular case.
Only the settings labeled with a
*are required.
Work Environment
| Field | What it does |
|---|---|
| Folder (+ Browse) | Root folder WalkStrat reads and writes everything under. Required before Save Settings will do anything. |
User Naming Convention
| Field | What it does |
|---|---|
| Prefix / Suffix | Free text combined with the original strategy name to build the generated strategy name and folder: Prefix + StrategyName + Suffix. Ships with defaults _TE / _ST. This is the name that the compiled strategy will use. |
Strategy Selection
| Field | What it does |
|---|---|
| Strategy dropdown | Shows every strategy currently compiled in TradeStation. Selecting one clears and repopulates the Inputs grid below. |
| Inputs grid | One row per input the selected strategy declares. Columns are Name, Start, Stop, Step. Leave Stop/Step blank on any input to be held fixed; fill all three on inputs to be optimized. At least one row has to be fully filled before Settings will save the configuration. |
Data Settings
| Field | What it does |
|---|---|
| Last Date | End date of the test window. |
| History Type + DaysBack | How much history to load — a day count or year count, selected by the History Type dropdown (Days / Years). Note this is trading days, not calendar days. |
| Use Real Validation checkbox + RV Percent | Holds out the last RV Percent% of the data history before Optimization or Feasibility ever runs — that reserved tail is never 'seen' by TradeStation, till the final Walk-Forward step, later in the flow. This is the current out-of-sample mechanism (see Key Concepts → Real Validation Holdout). |
Costs
| Field | What it does |
|---|---|
| Per Trade checkbox | Apply cost figures on a per-trade basis. |
| Commission | Dollars per contract, applied to every trade in the results. |
| Slippage | Ticks per side, same. |
Optimization Settings
| Field | What it does |
|---|---|
| Method | Exhaustive (every combination) or Genetic (evolutionary search — faster on large spaces, not guaranteed exhaustive). Selecting Genetic reveals a Genetic Optimization Settings panel: Population Size, Generations, Mutation Rate, Crossover Rate, and a "terminate if fitness hasn't improved for N generations" cutoff, all with sensible defaults that can be left alone unless there is a specific reason to tune them. |
| Fitness | The metric TradeStation maximizes: Net Profit, Avg Winning Trade, Expectancy Score, Max Intraday Drawdown, Percent Profitable, or Profit Factor. Defaults to Net Profit. |
Metrics
The thresholds grid that filters which optimization results survive into the first, basic filtering — this is the gate described in Optimization mode below. Change the defaults as needed. The Basic Metrics count lets WalkStrat know how many of the first four metrics must individually pass. Enable Binomial toggles additional screening of the statistically-lucky results.
Trades Settings
| Field | What it does |
|---|---|
| MaxBarsBack | Warm-up bars before the strategy is considered ready to trade. Match this to the strategy's slowest indicator lookback. |
| Look-Inside-Bar Type + Qty | Intrabar resolution: None / Tick / Second / Minute, plus a sub-bar count. |
| Trade Size | Contracts/shares per trade used for testing. |
Historical tick-data limits (a TradeStation platform limit, not an WalkStrat one). TradeStation only keeps about 6 months of tick-level history locally. Testing an expired futures contract older than 6 months at a Tick or Second Look-Inside-Bar resolution will fail with a data-acquisition error rather than complete — for deep historical testing, use Minute resolution instead. Look-Inside-Bar resolution also drives processing cost directly: a daily-chart backtest with 1-minute Look-Inside-Bar enabled evaluates roughly as many steps as a native 1-minute chart would, so optimizations can slow dramatically. Run the first parameter sweeps with Look-Inside-Bar set to None, and turn it on only for the shortlisted validation candidates.
Capital
| Field | What it does |
|---|---|
| Initial Capital | Starting account size used by cost/sizing calculations downstream. Defaults to 100000. |
Click Save Settings when done. If Working Folder, Strategy, or all optimization rows are incomplete, nothing is written and the status line reads:
Settings are not complete yet. Please select Working Folder, Strategy, and complete at least one optimization row.
Once everything required is filled, the status line instead reads "Settings are ready. Continue to Strategy Code." — click Save Settings and it confirms "Settings saved successfully." Any later edit to Working Folder, Strategy, or a grid cell disables Save and Next until the settings are saved again.
Click >> to move to Strategy Code.
Strategy Code
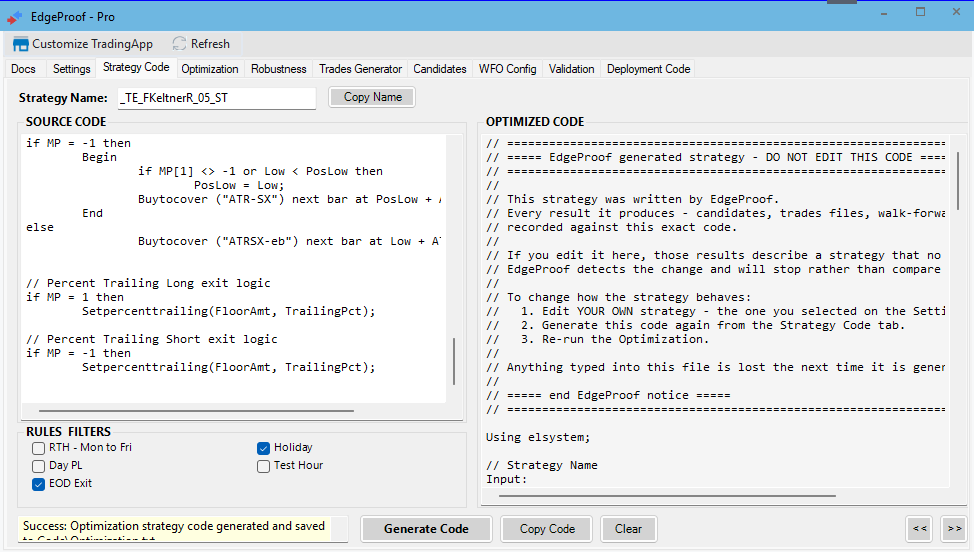 Strategy Code tabIllustrative result from a test run. No result predicts future performance.TradeStation Technologies, Inc. All rights reserved.
Takes the raw EasyLanguage strategy and produces the optimization-ready version WalkStrat will run through the process.
Strategy Name field at the top mirrors the name from Settings. It's editable here, and it's kept in sync with the same field on the Deployment Code tab — change it on either and the other updates. Copy Name beside it copies the current name to the clipboard.
SOURCE CODE panel (left) — paste the raw strategy (copied straight from the TradeStation Development Environment). If the strategy already has a name in its code, pasting automatically re-reads the StrategyName(...) input in the pasted source and may refresh the Strategy Name field to match it — when relying on the Prefix/Suffix name from Settings, paste the source before checking that the name field still reads as intended.
RULES & FILTERS — five checkboxes, all unchecked by default:
| Filter | What it does |
|---|---|
| RTH - Mon to Fri | Restricts trading to Regular Trading Hours, Monday–Friday. |
| Day P&L | Stops trading for the day once a profit/loss threshold is hit. |
| EOD Exit | Makes sure to close all positions before the day market close. |
| Time of day | Adds a Time of day filter for RTH. |
| Day of week | Adds a filter for every day of the week. |
Click Generate Code. WalkStrat reads the source, applies the checked filters, and writes the result to OPTIMIZED CODE panel, on the right. Status messages that may appear:
- "Ready. Paste source code and click Generate." — initial state
- "Settings changed or not yet saved. Click Save Settings before generating code." — go back to Settings first
- "Warning: Please paste source code first."
- "WalkStrat could not read that strategy. Check for stray brackets or a malformed Inputs or Vars section."
- "Success: Optimization strategy code generated and saved to Code\Optimization.txt."
The generated file is written to StrategyFolder\Code\Optimization.txt, regardless of which Prefix/Suffix or filter combination was used.
- Click Copy Name.
- In the TradeStation Development Environment: create a new strategy and paste the name in the wizard.
- Back in
WalkStrat, click Copy Code. - In the TradeStation Development Environment: paste the code and compile.
- Return to WalkStrat and click
>>to continue.
Clear wipes both panels and resets the status line to "Cleared. Ready for new strategy."
Optimization
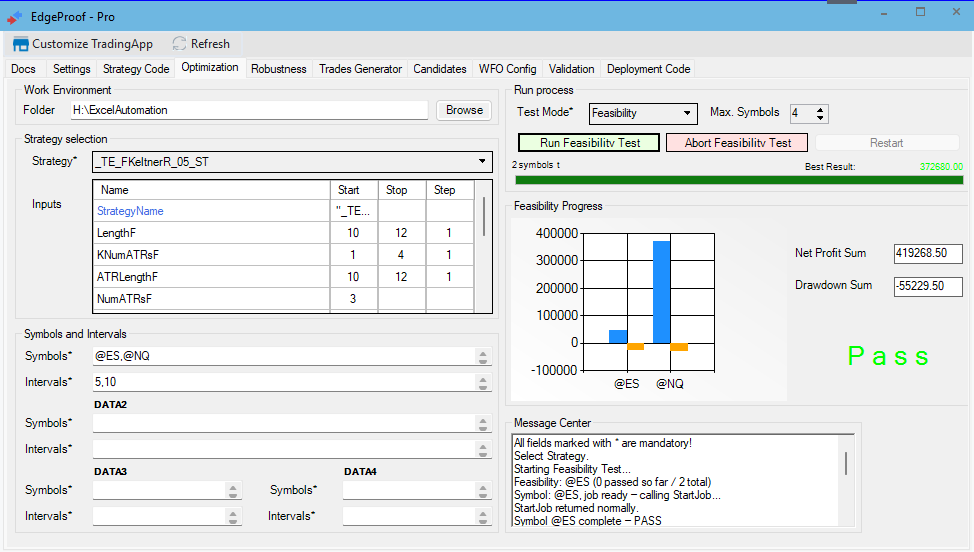 Optimization tab — FeasibilityIllustrative result from a test run. No result predicts future performance.TradeStation Technologies, Inc. All rights reserved.
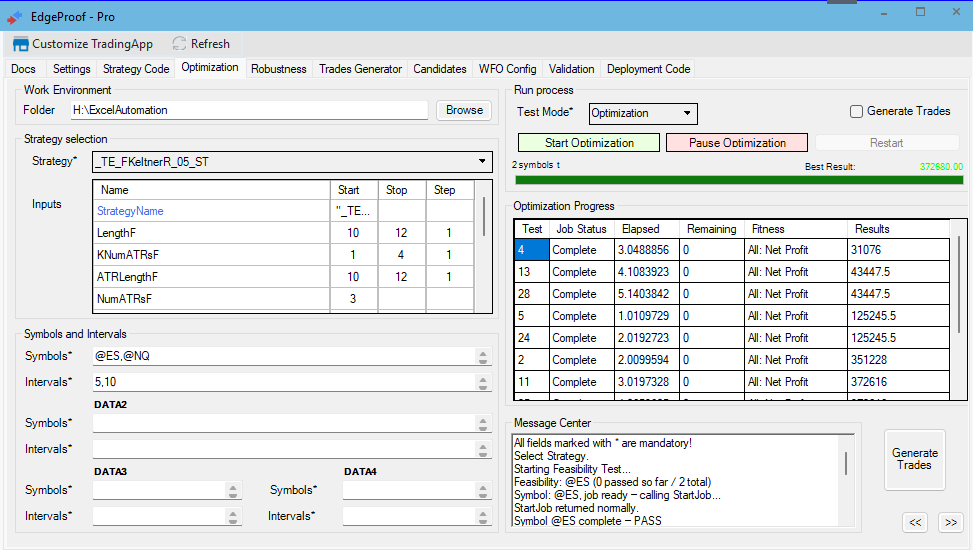 Optimization tab — OptimizationIllustrative result from a test run. No result predicts future performance.TradeStation Technologies, Inc. All rights reserved.
One tab, three modes (defaults to Optimization):
- Feasibility — selected only by the user, if needed.
- Optimization — selected automatically by the process or by the user in the Test Mode dropdown.
- Walk-Forward — selected automatically by the process or by the user in the Test Mode dropdown.
Everything on the tab — button captions, visible panels and messages — changes with the mode.
Note: To avoid confusion — "the Optimization tab" is this whole tab; "Test Mode: Optimization" is one of its three modes.
The Inputs grid and values, in Optimization and Walk-Forward, are already filled — carried over from the saved settings, if the Settings/Strategy Code route was used. All other settings are defaults, not fixed. Change
SymbolsandIntervalsofDATA1toDATA4, as needed, before running.
Symbols and data streams (all modes):
- DATA1 Symbols / DATA1 Intervals — the main data, where all Trades are executed; comma-separated, e.g.
@ES,@NQ/5,10. - DATA2 — optional. Can be either:
- Higher timeframes of the same Symbols as
DATA1, in which case all symbols fromDATA1have to be here too. VIX.X— both Symbol and Interval required.
- Higher timeframes of the same Symbols as
- DATA3 / DATA4 — optional supporting streams. Each requires both Symbol and Interval filled, or both left blank — filling only one throws "DATA2 requires both Symbol and Interval." (same message pattern for DATA3/DATA4).
Test Mode: Feasibility
A quick sanity check before committing to a full sweep — seconds, not hours. Unlike Optimization, Feasibility runs a single pass per symbol, across up to the first Max Symbols entries in the DATA1 Symbols list — a real edge in correlated e-mini index futures usually generalizes across the group, so clearing 2-4 symbols is a much stronger signal than clearing just one.
There's no field validation gate on this mode beyond the optimization grid itself — an empty Symbol won't be caught with a friendly message, so fill Symbol and Interval before clicking. If no input row has Start, Stop and Step set, the message reads "No optimization ranges defined — set Start/Stop/Step for at least one input in the grid."
- Set Test Mode to Feasibility.
- Set Max Symbols (1-4) — how many of the symbols listed in
DATA1 Symbolsto test this run. If fewer symbols are listed than Max Symbols, only the ones actually listed run. - Confirm Symbol/Interval and at least one Start/Stop/Step set are filled.
- Click Run Feasibility Test.
Symbols run one at a time, in the order listed. The Feasibility Progress chart builds up as each symbol finishes — one column pair per symbol (Net Profit in blue, Max Drawdown in orange), labeled by symbol. The Net Profit / Drawdown boxes next to the chart show the running sum across every symbol tested so far in this run, not just the last one.
The overall Pass (green) / Fail (red) indicator uses a majority rule: more than half of the tested symbols must individually pass (Net Profit > 1000 and Net Profit / |Max Drawdown| > 1.2) for the batch to read Pass. The Message Center logs each symbol's own result plus a final recap line, e.g. "── Feasibility Test Complete: 1/3 symbols passed ──".
Nothing is written to disk in this mode — it's a look, not a record. Click Abort Feasibility Test to cancel; there's no pause/resume in this mode. If a job fails partway through, the next Run Feasibility Test restarts the whole small batch from the first symbol rather than resuming mid-batch — Feasibility is meant to stay lightweight, so this trade-off is deliberate.
Test Mode: Optimization
The full parameter sweep — every combination (Exhaustive) or a genetic search, across every symbol/interval pair, filtered by the Metrics thresholds grid on Settings.
Mandatory before Start: Symbol and Interval filled for DATA1 through DATA4, as your strategy requires. Missing settings will show: "Fill all mandatory fields and Start again!"
- Set Test Mode to Optimization.
- Click Start Optimization.
The Optimization Progress grid fills in as tests complete, and the test counter accumulates across the whole batch rather than resetting each run. When the batch finishes, results are filtered through the Metrics thresholds and the parameter sets that passed, from every pair, are collected into a single file in Selected\.
Click Pause Optimization once, to pause execution. Pause happens after the current pair completes, and the "Start Optimization" button relabels to "Continue Optimization". Results completed so far are kept. Click Continue Optimization whenever ready to run the remaining pairs. To cancel execution, click Abort.
Trades Generator
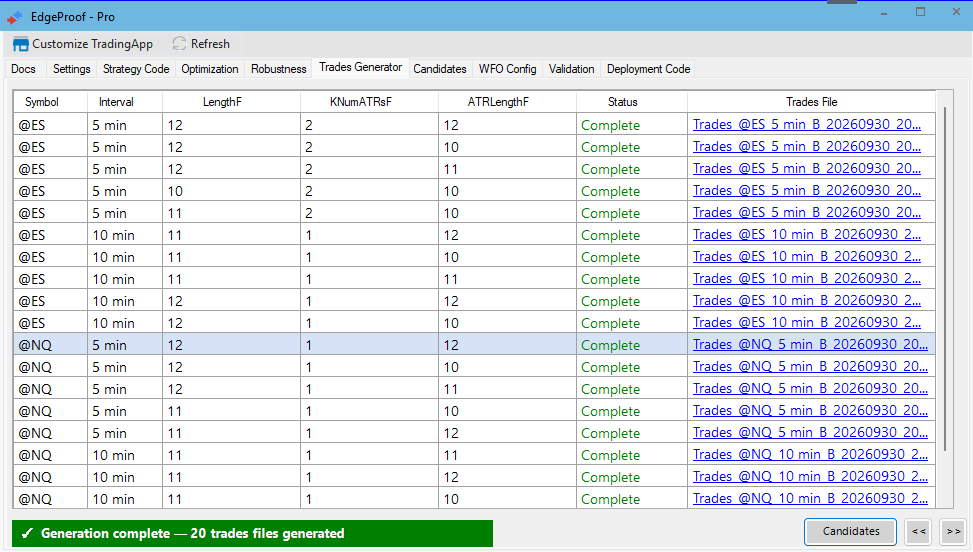 Trades Generator tabIllustrative result from a test run. No result predicts future performance.TradeStation Technologies, Inc. All rights reserved.
This tab only shows the status of each Trades file generation in a status grid. If the Generate Trades checkbox has been checked in the Optimization tab, Trades generation is fired automatically. Otherwise, click Generate Trades.
| Column | Description |
|---|---|
| Parameter columns | The specific input values for this candidate |
| Status | Working… (orange) while TradeStation regenerates that parameter set's trades, then one of the final outcomes below |
| Trades File | Clickable filename — opens the CSV with the system's default handler once complete |
Each row's final status reports what actually landed on disk, not merely that the job stopped running:
| Status | Meaning |
|---|---|
| Complete (green) | The file was written and contains trades. Hover for the trade count. |
| No trades (orange) | The file was written correctly, but this parameter set never entered a trade. A real result, not a failure — just nothing to analyse. |
| FAILED (red) | No usable file was produced. Hover for the reason. |
A green Complete means the file exists and has content in it — it is still not a quality signal about the strategy. There's no re-run button on this tab; to regenerate, go back to the Optimization tab and run Generate Trades again.
Hover a row (once it's Complete) to preview a small equity curve popup for that parameter set right in the grid — a quick visual gut-check without leaving this tab.
Click a row to jump straight to Candidates with that row's trades file already selected — the fastest way from a specific parameter set here into full analysis. Clicking the Trades File column specifically opens the CSV file directly.
The data stays local. Every trades file WalkStrat generates is written as a plain, unencrypted .csv under StrategyFolder\Trades\YYYYMMDD\ — on the local machine, not uploaded anywhere. Strategy logic, parameter sweeps, and trade history remain under local control throughout the pipeline.
Before anything has run, the tab shows: "Waiting for Trades Generator to run…" Once the batch finishes, a green banner confirms: "✓ Generation complete — {N} trades files generated." If anything failed, the banner turns red and says so instead — "2 of 20 generations FAILED — 18 files written".
When every row shows Complete, you're ready for either:
- Candidates — for a closer look at individual parameter sets, or
- WFO Config — the primary next step, to build the walk-forward plan
Click >> to continue to WFO Config.
WFO Config
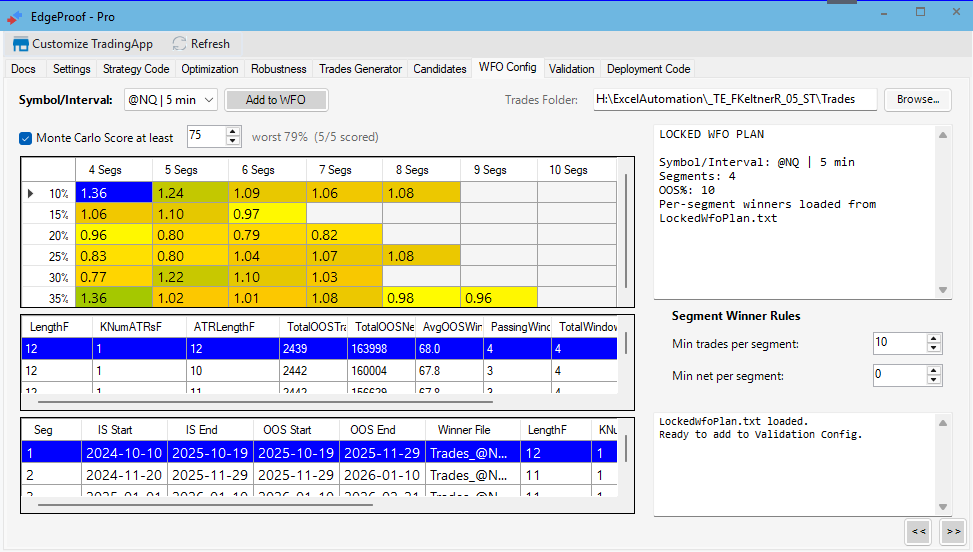 WFO Config tabIllustrative result from a test run. No result predicts future performance.TradeStation Technologies, Inc. All rights reserved.
This is where the walk-forward plan is chosen and committed to Walk-Forward. Selecting a Symbol/Interval pair from the dropdown at the top immediately loads every matching candidate and builds the full scoring matrix.
The matrix has 7 columns (4 through 10 segments) and 6 rows (10% through 35% OOS), 42 cells total. Each cell scores a walk-forward simulation across every candidate for that segment count and OOS split, using a fast approximation that slices the generated trades files. This is not the real segment-by-segment re-optimization — that happens during Walk-Forward.
Cell value is an efficiency ratio — money earned per day out-of-sample, divided by money earned per day in-sample:
- Blank / pink — at least one segment lost money out-of-sample, or there wasn't enough data to score. Never pick these.
- Orange/yellow — under 1.0: OOS underperforms IS. Marginal.
- Green, darker with higher value — 1.0 and above: OOS holding its own or outperforming IS on a per-day basis. From 2.0 up, the cell renders as solid dark green.
Click a scored cell to see the detail behind it: a ranked list of every candidate's out-of-sample performance for that configuration, and a per-segment breakdown showing which parameter set won each in-sample window and how it performed out-of-sample. This click also immediately saves the selection, so navigating away and back restores the last choice.
Click Add to WFO to commit the selected cell. A message box confirms "Candidate added!" along with the run's details. If the trades folder was regenerated since the matrix was loaded, a prompt asks to reselect: "Matrix is stale - its trades files no longer exist (regenerated?). Re-select the Symbol/Interval pair and click a matrix cell again."
To validate more than one configuration in the same session, repeat — select, inspect, Add to WFO — once for each Symbol/Interval or matrix combination to be run.
Avoid a single green cell surrounded by blanks or orange — that's usually a sampling artifact, not a robust configuration. Prefer a cluster of similarly-scored green cells across neighboring Segment/OOS% values, and check that different segments in the detail view picked different winning parameter sets — if every segment picked the same winner, the strategy isn't really demonstrating adaptability.
Click >> to continue to the Optimization tab, Test Mode Walk-Forward, and click Start Walk-Forward to run it.
Walk-Forward Run (Optimization tab)
Test Mode: Walk-Forward
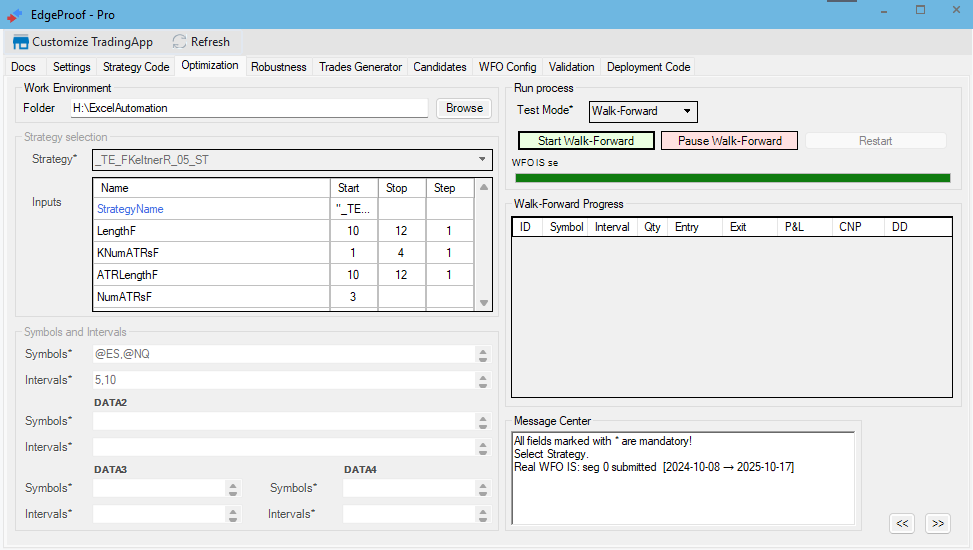 Optimization tab — Walk-ForwardIllustrative result from a test run. No result predicts future performance.TradeStation Technologies, Inc. All rights reserved.
Runs the Real Walk-Forward Optimization plan locked in on the WFO Config tab. This mode has no field validation of its own — Symbol, Interval, and every date window come from the walk-forward plan locked in on WFO Config. If no plan has been locked in yet: "No walk-forward plan found. Run WFO Config first."
- Complete WFO Config first — the section on that tab explains how.
- Set Test Mode to Walk-Forward.
- Click Start Walk-Forward.
Click Pause Walk-Forward once, to pause execution. Pause happens after the current job completes, and the "Start Walk-Forward" button relabels to "Continue Walk-Forward". Results completed so far are kept. Click Continue Walk-Forward whenever ready to execute the remaining segments. To cancel execution, click Abort.
From here the app runs unattended: for each segment in the WFO plan it optimizes on the in-sample window, automatically picks a winner, locks those parameters, and re-runs the out-of-sample window. It repeats this for every segment, stitches the out-of-sample trades together, and — if Real Validation was on when the plan was built — runs one final backtest over the held-out tail. If more than one WFO configuration is queued, it moves straight on to the next once the current one finishes; "All queued Real WFO runs complete!" appears when there's nothing left.
The Walk-Forward Progress chart shows the run's progress, while the message log reports the detailed state. The on-screen segment counter is cosmetic and shouldn't be read as an exact position indicator.
Robustness
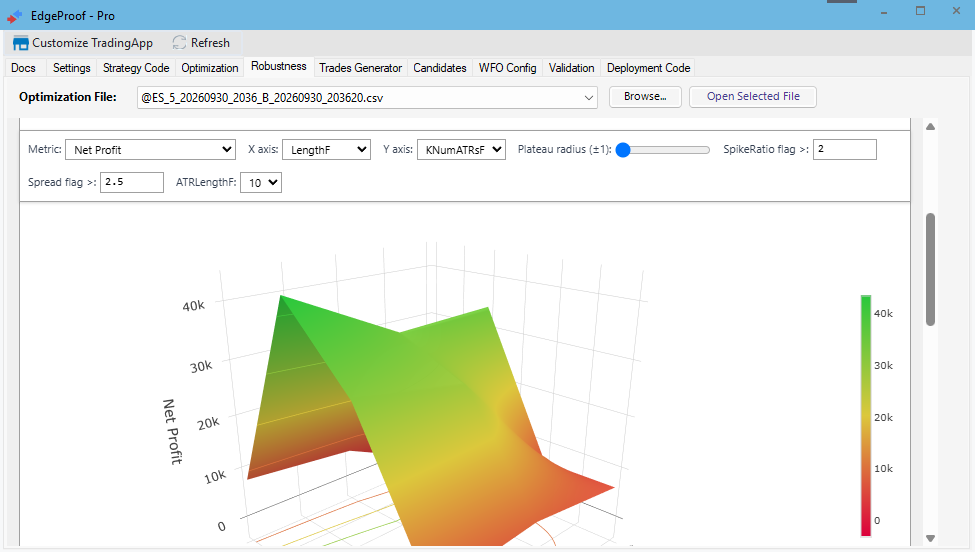 Robustness tabIllustrative result from a test run. No result predicts future performance.TradeStation Technologies, Inc. All rights reserved.
A visual check on how stable the optimization results are across nearby parameter values. It asks the same question the Validation stability check does — does this setting still work if nudged? — but based on the initial optimization across the whole history, and is only for the user to read and decide. Nothing on this tab feeds any decision the app makes.
Pick an Optimization File — one of the raw result CSVs the strategy folder accumulates from Test Mode: Optimization — from the dropdown, or Browse… to one directly. Open Selected File opens it outside the app for inspecting the raw numbers.
The main view is a 3D surface: two of the swept parameters on the horizontal axes, Net Profit on the vertical axis, with a matching heatmap beside it. A broad, smoothly-sloped profitable region means nearby parameter combinations behave similarly — a plateau that can be trusted. A sharp, narrow peak surrounded by poor results is a warning: the optimizer found one lucky combination rather than a durable edge.
Candidates
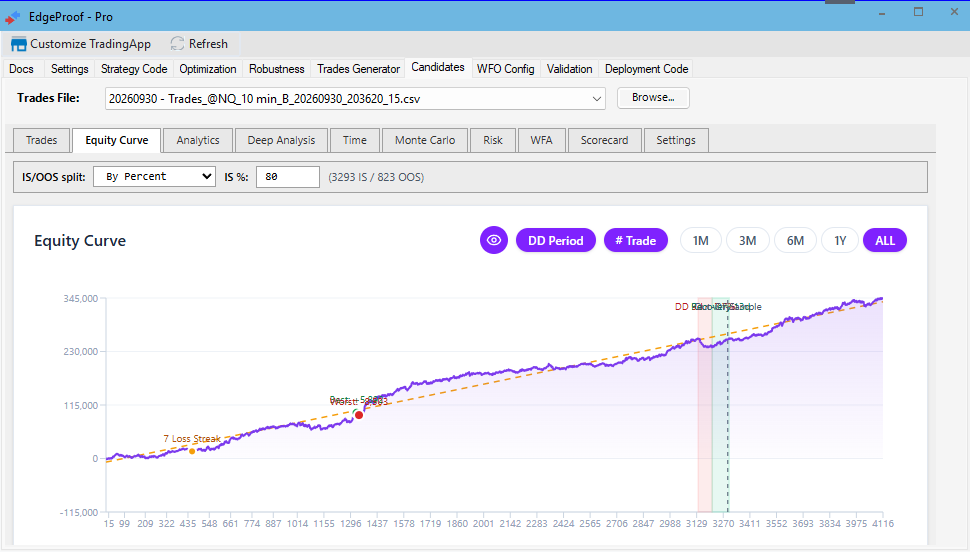 Candidates tab — Equity CurveIllustrative result from a test run. No result predicts future performance.TradeStation Technologies, Inc. All rights reserved.
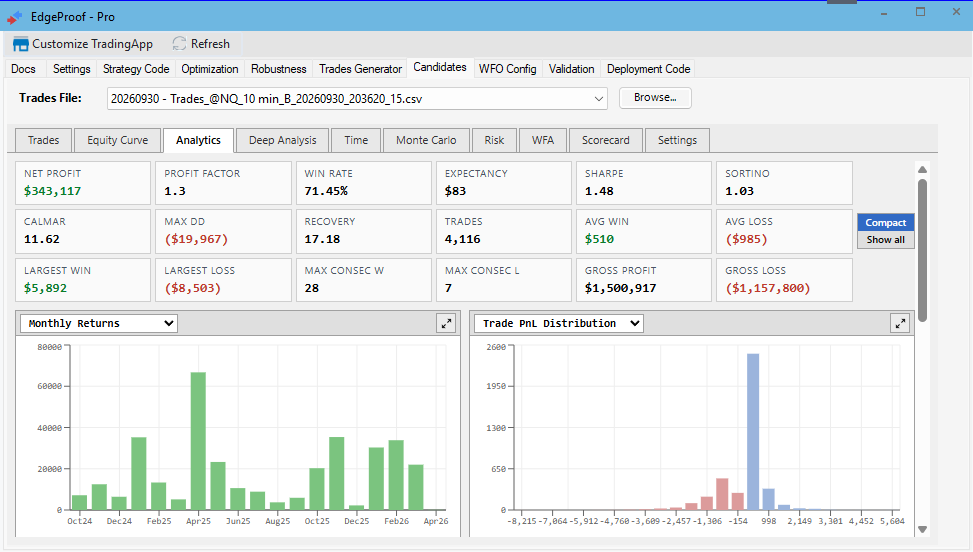 Candidates tab — AnalyticsIllustrative result from a test run. No result predicts future performance.TradeStation Technologies, Inc. All rights reserved.
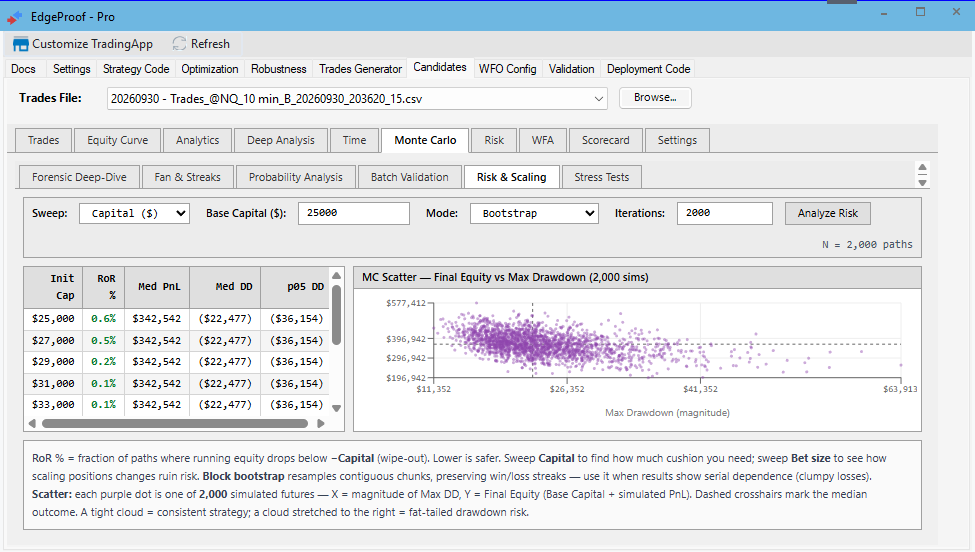 Candidates tab — Monte CarloIllustrative result from a test run. No result predicts future performance.TradeStation Technologies, Inc. All rights reserved.
The analysis hub for individual trades files, reading whichever trades file the tab was opened with. There's no forward/back wizard button here; open it any time once trades files exist. This tab opens as an embedded view of WalkStrat's companion analysis interface.
Tab strip: Trades · Equity Curve · Analytics · Deep Analysis · Time · Monte Carlo · Risk · WFA · Scorecard · Settings.
- Trades — a sortable, filterable blotter (Direction filter, Profitable-only toggle, live trade count and total P&L, CSV export).
- Equity Curve — cumulative equity with a range toggle (1M/3M/6M/1Y/ALL), an IS/OOS split control, and automatic annotations: shaded drawdown/recovery regions, Best/Worst trade markers, and footer KPIs (Max Drawdown %, Annualized ROI, GHPR).
- Analytics — a KPI dashboard (Net Profit, Profit Factor, Win Rate, Expectancy, Sharpe, Sortino, Calmar, Max DD, Recovery Factor, and more) alongside Monthly Returns, Drawdown, Rolling Sharpe/Sortino, Rolling Win Rate, Trade Distribution, and Long-vs-Short charts, a Monthly Heatmap, a Duration-vs-PnL scatter, and By Direction / By Symbol breakdown tables.
- Deep Analysis — opens with the binomial "randomness" test (is this win rate better than a coin flip, given the trade count?), then — where the trade CSV includes the relevant columns — cost-drag, MAE/MFE, and bars-in-trade charts.
- Time — three views (Tables, Heatmap, Calendar) breaking performance down by hour of day, day of week, and month.
- Monte Carlo — five views; see below.
- Risk — an R-multiple risk breakdown (normalized to
TradePnL ÷ |MAE|) and a slippage-sensitivity sweep showing your strategy's break-even ticks-per-side and a survival table across a range of slippage assumptions. - WFA — exploratory walk-forward analysis on this one candidate's executed trades: a segment-by-segment "Test Results" view and a "Cluster Analysis" heatmap sweeping segment count × OOS%, both governed by a shared, editable PASS/FAIL rules popover. This is exploratory only — it does not feed the actual locked WFO plan, which is decided on the WFO Config tab.
- Settings — a read-only summary of this candidate's symbol, interval, date range, strategy, inputs, and trade size, pulled automatically from the per-candidate settings file WalkStrat writes alongside the trades CSV. Blank if no matching settings file was found.
Monte Carlo
Five views, each answering a different robustness question about the selected candidate.
Forensic Deep-Dive — set Iterations (default 5,000), Seed, Mode (Shuffle, reordering the actual trades with every P&L value unchanged, or Bootstrap, resampling trades with replacement), and a Capital figure for an inline Risk-of-Ruin readout. Results show the simulated median and 5th-percentile-worst outcomes alongside the actual result, plus two histograms — Final Equity and Max Drawdown distributions. A tight histogram means trade order barely matters; a wide one means the result depended on favorable sequencing.
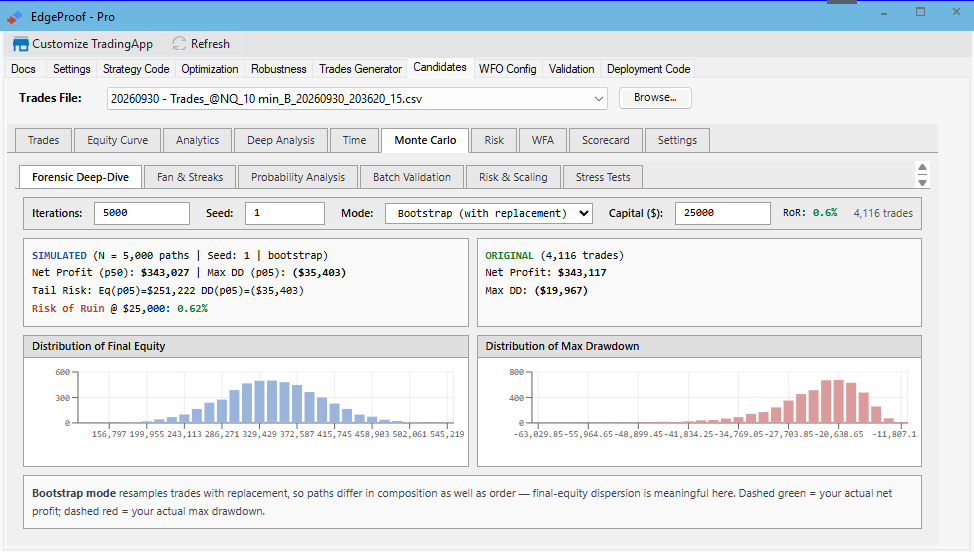 Monte Carlo — Forensic Deep-DiveIllustrative result from a test run. No result predicts future performance.TradeStation Technologies, Inc. All rights reserved.
Fan & Streaks — an equity "fan chart": a cone of simulated equity paths at each trade index (5th/25th/50th/75th/95th percentile bands), with the actual historical equity overlaid — near the top of the cone is a lucky run, near the bottom unlucky, the middle is typical. Alongside it, a distribution of the longest losing streak seen across simulations. A Block bootstrap mode is available here for strategies where trades are serially correlated — it resamples contiguous chunks instead of individual trades, which usually widens the fan when that correlation is real.
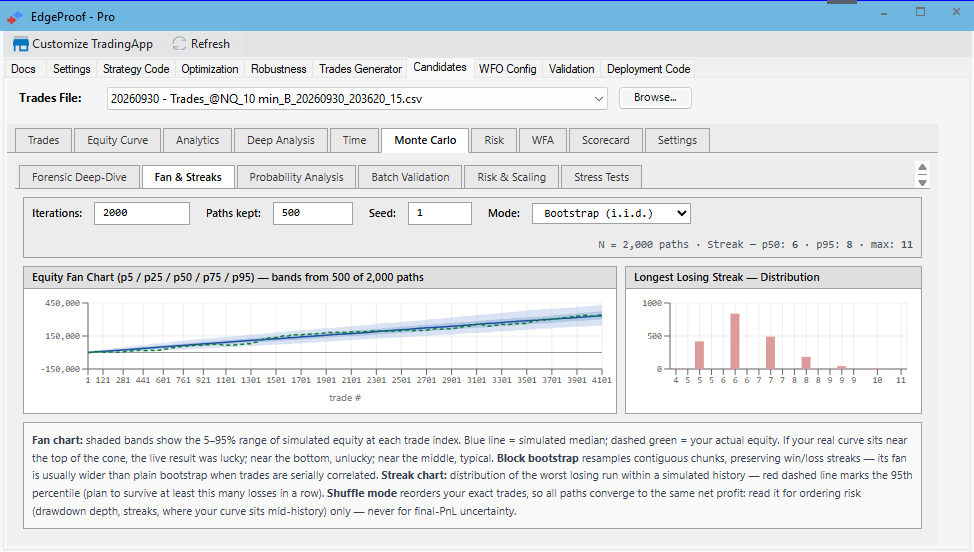 Monte Carlo — Fan & StreaksIllustrative result from a test run. No result predicts future performance.TradeStation Technologies, Inc. All rights reserved.
Probability Analysis — two cumulative-probability curves: what fraction of simulations achieved a given net profit or better, and what fraction experienced a given drawdown or worse. Use the drawdown curve to size positions, not the single historical worst case.
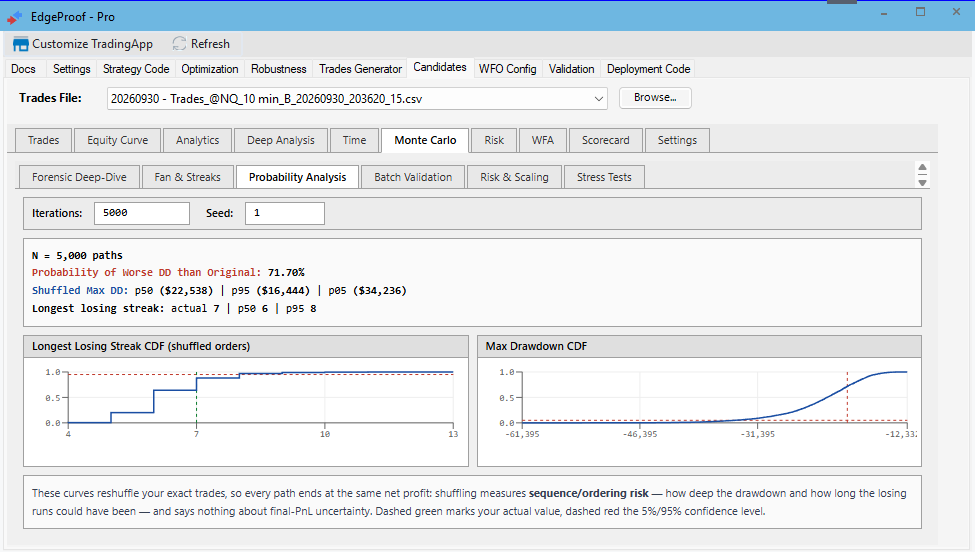 Monte Carlo — Probability AnalysisIllustrative result from a test run. No result predicts future performance.TradeStation Technologies, Inc. All rights reserved.
Batch Validation — reruns the shuffle test across 10 fixed random seeds for this one candidate and reports Original DD vs. simulated worst-case DD per seed, with a Pass/Fail (Lucky) status per seed — a robustness check on this specific parameter set, not a scan across your whole candidate pool.
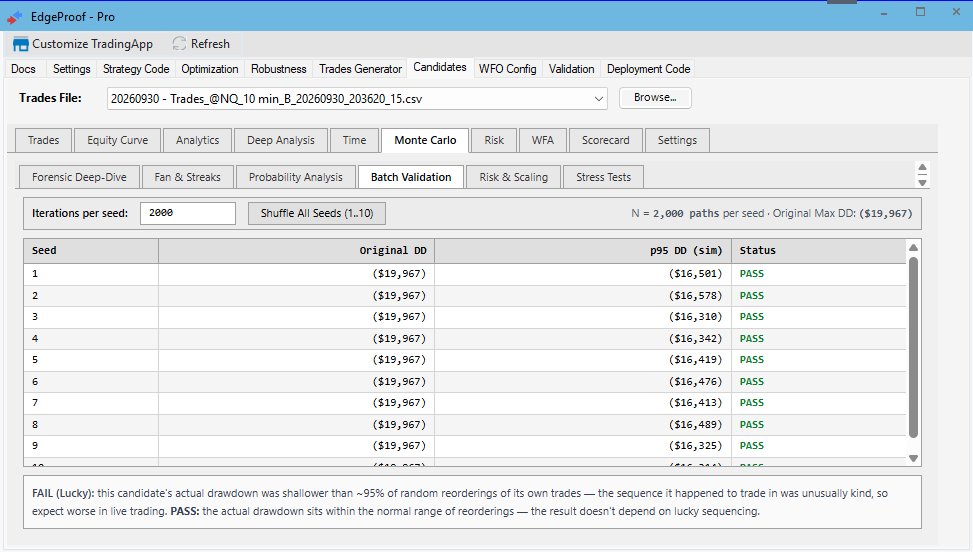 Monte Carlo — Batch ValidationIllustrative result from a test run. No result predicts future performance.TradeStation Technologies, Inc. All rights reserved.
Risk & Scaling — choose what to sweep (Capital ($) or Bet size (×)), a simulation Mode (Bootstrap / Block bootstrap / Shuffle), and click Analyze Risk. Produces a table of tiers with Risk of Ruin percentage, median PnL, median drawdown, and a worst-case (5th percentile) drawdown at each tier — color-coded by Risk of Ruin. A scatter chart alongside it plots final equity against max drawdown across every simulated scenario, with crosshairs at the median.
Validation
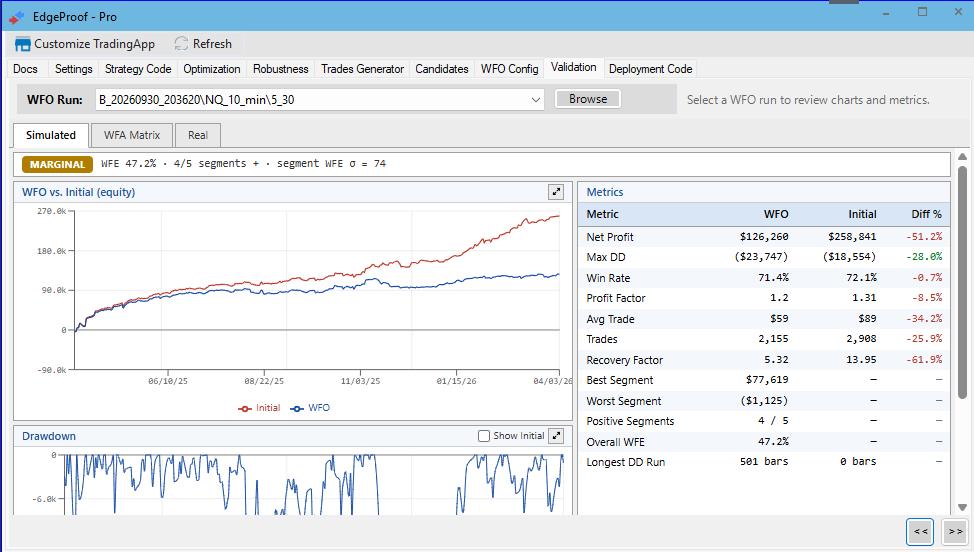 Validation tab — SimulatedIllustrative result from a test run. No result predicts future performance.TradeStation Technologies, Inc. All rights reserved.
Shows the outcome of a completed Walk-Forward run — how the strategy performed on data it was never optimized on, one segment at a time.
WFO Run dropdown lists completed runs (newest first). Selecting one populates three inner views: Simulated answers did the walk-forward beat the baseline overall, WFA Matrix shows what happened segment by segment, and Real shows the final holdout run, if Use Real Validation was selected.
Simulated
The headline comparison: the walk-forward result (WFO, blue) against a full-history-best baseline (Initial, red) restricted to the same out-of-sample windows so the two are comparable apples-to-apples. If no exact matching baseline can be found, the app falls back to the nearest candidate and flags it: "Exact param match not found. Arbitrary baseline used for comparison."
- Equity chart — the two curves overlaid.
- Drawdown chart — underneath, with a Show Initial toggle.
- Metrics table — WFO / Initial / Diff% for Net Profit, Max DD, Win Rate, Profit Factor, Avg Trade and Trades, then walk-forward-specific rows that have no baseline to compare against: Recovery Factor, Best Segment, Worst Segment, Positive Segments, Overall WFE and Longest DD Run. Diff% is coloured so a negative divergence stands out.
Reading it: WFO tracking or beating Initial is a strong result — the strategy generalizes. WFO clearly below Initial means real-world, walk-forward performance falls well short of what a full-history optimization implied — normal to some degree, concerning if the gap is large. If the app can't establish out-of-sample date windows for the baseline at all, it hides the Initial line rather than show a misleading comparison: "The out-of-sample windows could not be established, so the Initial comparison is hidden. Run WFO Config for this strategy first."
Segments without a proper winner. If no parameter set met the Segment Winner Rules (enough trades and a net profit) in a segment's in-sample window, that segment is marked FAIL — No qualified winner. If its winner was profitable but only an isolated spike, a segment that would otherwise pass shows WARN — Winner on unstable ground. Both are marked ⚠, and the verdict is lowered to MARGINAL when more than a third of the segments are affected, or when the last one is.
WFA Matrix
One row per segment, showing what was chosen and how it held up. A summary strip along the top gives the pass rate, median efficiency, total out-of-sample result, and the worst Spike and Spread across all segments.
| Column | What it indicates |
|---|---|
| OOS Start / OOS End | The dates that segment was tested on |
| IS Net / IS Tr / IS $/Tr | How the chosen parameters did on the data they were fitted to |
| Spike / Spread | How trustworthy that choice was |
| OOS Net / OOS Tr / OOS $/Tr | How they did on data they had never seen |
| Eff % | Out-of-sample result as a share of in-sample, per trade — above 100% means it did better on unseen data than on the data it was fitted to |
| State | PASS, FAIL, or N/A when the segment had too few out-of-sample trades to judge |
| Chosen params | The winning values for that segment, under the strategy's own input names |
Two charts sit underneath: efficiency per segment, and parameter drift — how each winning value moved across segments. Some drift is healthy and shows the strategy adapting. A parameter that never moves at all, or one that jumps erratically, is worth a second look.
Segments with too few out-of-sample trades are reported N/A rather than FAIL, and are left out of the pass rate — a segment that barely traded hasn't earned a verdict either way. Set the trade minimum with Min OOS trades at the top.
Real
Only appears if Real Validation was enabled when the plan was built. Shows a single equity curve and the same metrics table, this time for the one final holdout backtest run over the tail of history that was never touched by any optimization or walk-forward segment — the closest thing this app produces to an out-of-time test. No WFO-vs-Initial comparison here; it's one number, standing alone. Appears automatically once a Real Validation run completes.
Click >> to continue to Deployment Code.
Deployment Code
Produces the final EasyLanguage code from the strategy generated on the Strategy Code tab. It changes only the selected Input default values; the rest of the strategy code stays unchanged. This is the last tab; there's no >> forward from here.
The parameters come from the last walk-forward segment. If that segment has no qualified winner, there is nothing validated to deploy and no code is generated. If its winner sits on unstable ground, the code is generated with a caution.
Strategy Name field is synced with the same field on the Strategy Code tab.
SOURCE CODE panel (left) is a reference view only — click Load Strategy to load the current Optimization.txt generated on the Strategy Code tab. Editing this panel does nothing to the generated output — Generate Code always works from that saved Strategy Code output, not from what is showing in this panel. Use Load Strategy to inspect the source, not to make changes.
Click Generate Code. It:
- Reads
Code\Optimization.txtfresh. - Reads the selected parameter values from the most recent Validation results.
- Changes only the strategy's Input default values to that selected set. Nothing else in the EasyLanguage code changes.
- Optionally changes
...__Optin the strategy name to...__Live. The name can also be changed before compiling in TradeStation.
Output is saved to Code\Live.txt and shown in DEPLOYMENT CODE on the right. If no walk-forward parameters were found, the status line says so: "Code generated and saved to Code\Live.txt (no parameter set applied)" — worth double-checking before compiling if specific values were expected.
- (optional) Click Copy Name.
- (optional) In the TradeStation Development Environment: create a new strategy and paste the name.
- Back in WalkStrat, click Copy Code.
- In the TradeStation Development Environment: paste the code and compile.
- Run the compiled strategy in TradeStation as required. This last step is entirely manual — WalkStrat never places trades or attaches strategies to charts.
Clear resets both panels to "Cleared. Ready for new strategy."
Docs
Reference material built into the app itself — the app's own documentation, available any time from the front of the tab strip, independent of where you are in the workflow.
A note on >> / << navigation
These buttons jump to a specific named tab, not simply "next tab over" — and a couple of them branch depending on which Test Mode is currently selected:
- Settings
>>→ Strategy Code - Strategy Code
>>→ Optimization - Optimization
<<→ WFO Config if Test Mode is Walk-Forward, otherwise Strategy Code - Optimization
>>→ Trades Generator if Test Mode is Optimization; Validation if Test Mode is Walk-Forward. - Trades Generator
>>→ WFO Config - WFO Config
>>→ back to the Optimization tab (Walk-Forward mode) - Validation
<<→ Optimization tab (Walk-Forward mode);>>→ Deployment Code - Deployment Code
<<→ Validation; there is no>>
Candidates has no >>/<< at all — it can be reached at any point after trades files exist by clicking its tab header, clicking the Candidates button on the Trades Generator tab, or clicking any row in the Trades files grid.